11 Swanmore Avenue, Southampton, SO19 1BL
About 11 Swanmore Avenue
11 Swanmore Avenue is a two-bedroom semi-detached house in Southampton (SO19 1BL). It has a recorded floor area of 80 m² (around 861 sq ft), construction records dating it to 1930-1949 and council tax band C. The latest certificate (December 2019) shows a C (score 69), just inside the C band. When first surveyed in April 2010 the rating was E, the property has climbed 2 bands since. Between certificates, window efficiency went from Poor to Average, hot-water efficiency went from Average to Good and lighting went from Poor to Very Good. The recommended improvements would push it to B (score 86). Records show the property has been extended at some point in its history. The home occupies a cul-de-sac position.
Its energy rating outperforms most of the postcode (better than 74% of similar EPCs). Across 2002–2020, sale prices on this property compounded at 6.1% per year. Today's modelled estimate of £299,000 is 32.9% above the 2020 sale price. On a £-per-square-foot basis, the last sale (£261/sq ft) was about 46.9% above the typical sold price in the postcode. Sold May 2020 for £225,000.
What this property has
Inside
- Bedrooms2
- Bathrooms1
- Dining roomYes
- Utility roomYes
- CloakroomYes
Outside
- DrivewayYes
- Cul-de-sacYes
Building
- Previously extendedYes
- RefurbishedYes
Everything you need to know about 11 Swanmore Avenue
The true value, the hidden risks and the full sale history, in one report.
Pick your report · from £14.99
One time fee only - money back guarantee
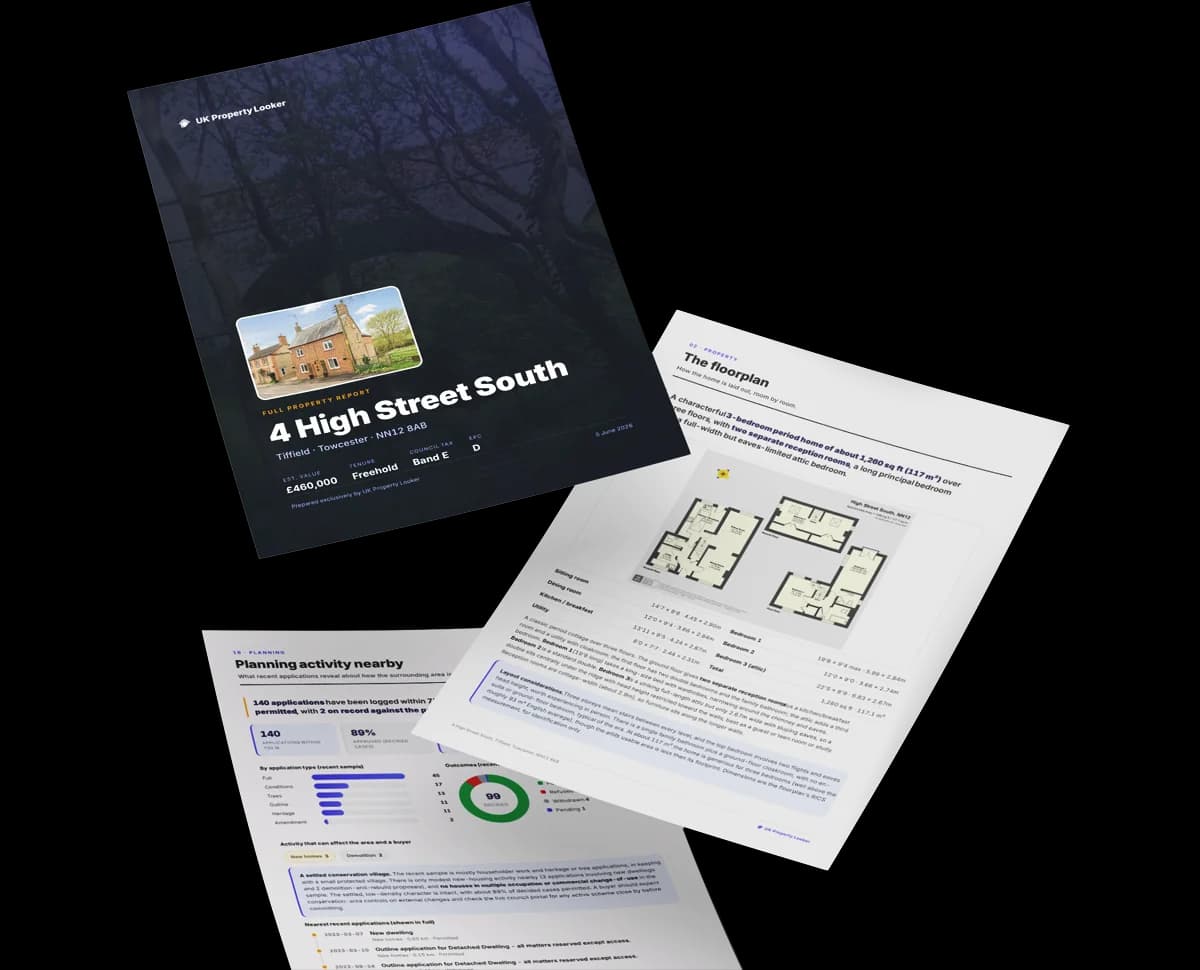
The data behind every report







Energy performance
EPC Rating
Certificate validity
Valid until 7 December 2029
Property Improvements
Changes detected from historical EPC data
Heating controls upgraded for better temperature management
Hot water efficiency improved
Windows upgraded, improving insulation
More low energy lighting installed

Get a survey for this property
Level 2 HomeBuyer Report
We've checked 10 risk factors against the available data for this property and believe a Level 2 HomeBuyer Report could be a suitable option for you.
From £545 · Includes VAT
Planning history
11 Swanmore Avenue has no planning applications on record.
A planning report still maps activity across the surrounding area and reads this property's extension & conversion potential.
Sales history & valuation
11 Swanmore Avenue has more than doubled in price since the earliest registered sale in 2002.
£299,000
Modelled from EPC, postcode comparables and a sale-price growth of 6.1% per year over 18 years.
£225,000
Growth on file: 6.1% per year over 18 years.
Sales timeline
31 May 2020Most recent
£225,000
+31.6%over 4 years23 December 2015
£171,000
+125.0%over 13 years19 February 2002
£76,000
Median price across the last 5 sales in SO19 1BL: £275,000 (2025–2024).
Nearby sales in SO19 1BL
24 Swanmore Avenue, Southampton, SO19 1BL
Sold Oct 2025
£275,00025 Swanmore Avenue, Southampton, SO19 1BL
Sold Jun 2025
£290,00032 Swanmore Avenue, Southampton, SO19 1BL
Sold Jan 2025
£355,00010 Swanmore Avenue, Southampton, SO19 1BL
Sold Jul 2024
£248,75030 Swanmore Avenue, Southampton, SO19 1BL
Sold Nov 2023
£345,000
Versus other Swanmore Avenue homes
11 Swanmore Avenue outperforms the street on habitable rooms by a wide margin.
Price per m²
£2,813
Street avg £2,948
Floor Area
80 m²
Street avg 84 m²
Habitable Rooms
5 rooms
Street avg 4 rooms
CO₂ Emissions
2.7 t/year
Street avg 3.4 t/year
Everything you need to know about 11 Swanmore Avenue
The true value, the hidden risks and the full sale history, in one report.
Pick your report · from £14.99
One time fee only - money back guarantee
The data behind every report
Similar properties nearby
The neighbourhood at a glance
Crime
493/mo
Steady year-on-year across the wider district.
Nearest stop
0.2 km
Landseer Road — bus stop.
Closest school
0.4 km
Valentine Primary School & Nursery. 28 schools nearby.
Go deeper on the local area
A Local Area report breaks down crime, transport links, schools and air quality in depth.
Road noise across the postcode
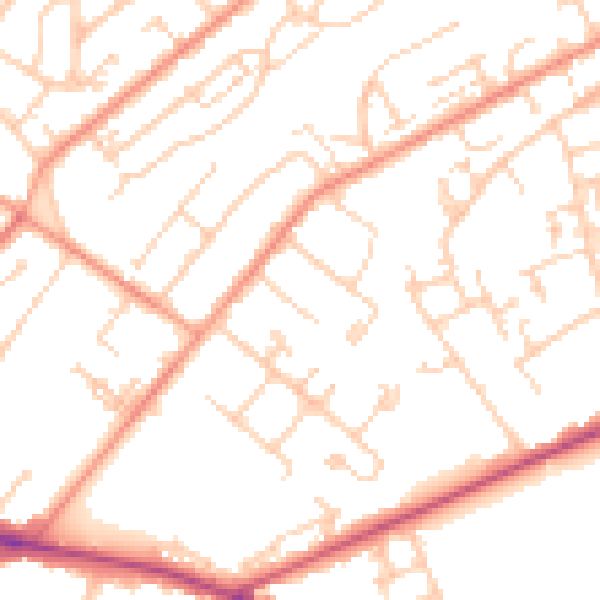
Daytime· 07:00 – 23:00
51.1dB

Night-time· 23:00 – 07:00
40.3dB