369 Lytham Road, Blackpool, FY4 1EA
About 369 Lytham Road
369 Lytham Road is a two-bedroom mid-terrace house in Blackpool (FY4 1EA). It has a recorded floor area of 72 m² (around 775 sq ft) and construction records dating it to 1900-1929. The latest certificate (September 2025) shows a D (score 63), on the cusp of jumping into the C band. When first surveyed in September 2009 the rating was G, the property has climbed 3 bands since. Between certificates, wall efficiency went from Poor to Good, roof efficiency went from Very Poor to Average and lighting went from Poor to Good; while window efficiency dropped from Good to Average. The recommended improvements would push it to C (score 77). Main heating runs on electricity. At 72 m² this is the 7th smallest of 11 units on EPC record in the building, where floor areas span 21–163 m². The building's EPC ratings span G to C across 11 units on file.
Across 1999–2008, sale prices on this property compounded at 21.9% per year. Today's modelled estimate of £187,000 is 20.4% below the 2008 sale of £235,000, an unusual pattern given regional price growth and worth checking against the EPC condition. On a £-per-square-foot basis, the last sale (£303/sq ft) was about 200.6% above the typical sold price in the postcode. Untraded for 18 years, with the last transfer in May 2008. That sale landed at the peak of the pre-credit-crunch market, which is a useful reference point when interpreting the price. One planning record on file: subdivision approved in 2004. Past consents include subdivision, meaningful when judging how the property has evolved. At 72 m² it's 25.2% larger than the typical home in the postcode (58 m² median across 10 EPCs).
What this property has
Inside
- Bedrooms2
- Bathrooms1
Outside
- Private gardenRear
Building
- Heating systemGas
Everything you need to know about 369 Lytham Road
The true value, the hidden risks and the full sale history, in one report.
Pick your report · from £14.99
One time fee only - money back guarantee
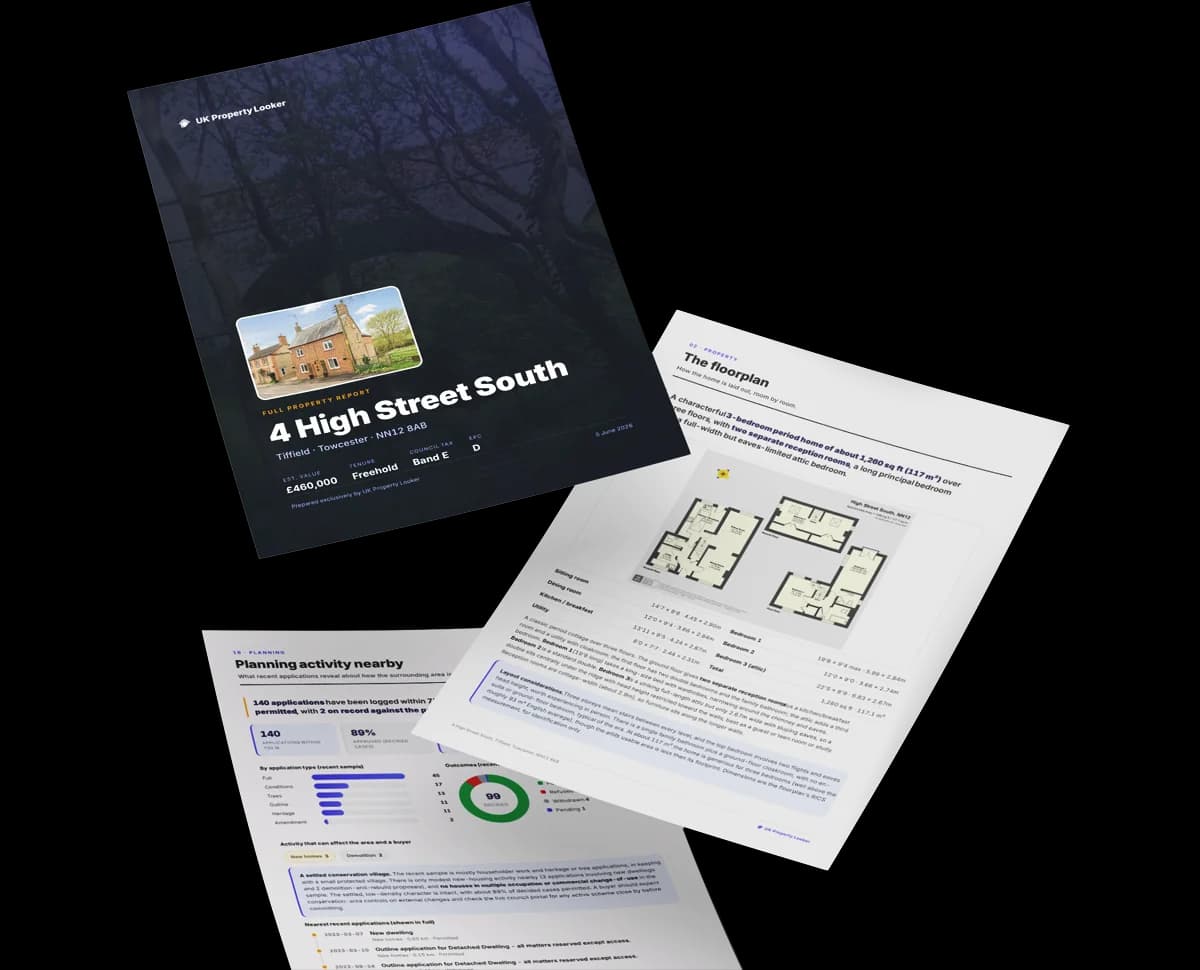
The data behind every report







Energy performance
369 Lytham Road's carbon output is low for the local stock.
EPC Rating
Certificate validity
Valid until 23 September 2035
Property Improvements
Changes detected from historical EPC data
Heating system upgraded to a more efficient system
Hot water system upgraded
Heating system changed
Hot water system changed
Windows upgraded to triple glazing
Wall insulation improved
Loft insulation installed or upgraded to 250mm+
More low energy lighting installed

Get a survey for this property
Level 3 Building Survey
Because the property was built before 1919 and has no mains gas supply, we believe a Level 3 building survey should be considered.
From £820 · Includes VAT
Planning history
Council records show a subdivision application — the property's legal arrangement has been altered.
1 application on record at 369 Lytham Road, Blackpool, FY4 1EA
- Jun 2004SubdivisionAmendmentOutcome in report
Use of premises as three self contained permanent flats.
- Documents
- 1 doc on file
- Reference
- 04/0452
Unlock 369 Lytham Road, Blackpool, FY4 1EA's full planning history
You're seeing the shape of it. The report has the substance.
- Every decision — granted, refused or withdrawn (1 on record)
- All 1 application on this property in full
- The 1 documents, officer reports & conditions
- What the pattern means for extending or converting here
One time fee only - money back guarantee
Sales history & valuation
Latest sale on 369 Lytham Road was the highest on Land Registry record across the postcode.
£187,000
Modelled from EPC, postcode comparables and a sale-price growth of 21.9% per year over 9 years.
£235,000
Growth on file: 21.9% per year over 9 years.
Sales timeline
29 May 2008Most recent
£235,000
+67.9%over 3 years2 August 2004
£140,000
+225.6%over 4 years1 November 1999
£43,000
Median price across the last 5 sales in FY4 1EA: £107,500 (2022–2008).
Nearby sales in FY4 1EA
Versus other Lytham Road homes
On co₂ emissions, 369 Lytham Road stands well clear of the street.
Price per m²
£3,264
Street avg £3,019
Floor Area
72 m²
Street avg 51 m²
Habitable Rooms
3 rooms
Street avg 2 rooms
CO₂ Emissions
0.8 t/year
Street avg 2.9 t/year
Everything you need to know about 369 Lytham Road
The true value, the hidden risks and the full sale history, in one report.
Pick your report · from £14.99
One time fee only - money back guarantee
The data behind every report
Similar properties nearby
1 Allandale
FY4 1RH
1 Clifton Court, Clifton Drive
FY4 1NU
1 Hillcrest Road
FY4 1QT
1 Kidbrooke Avenue
FY4 1QR
1 Freemantle Avenue
FY4 1SX
1 Bosworth Place
FY4 1SH
1 Arlington Avenue
FY4 1EL
1 Hill Street
FY4 1DG
The neighbourhood at a glance
Rail-style transport is unusually close for this postcode.
Crime
420/mo
Falling year-on-year across the wider district.
Nearest stop
0.2 km
Thames Road — bus stop.
Closest school
0.3 km
Thames Primary Academy. 20 schools nearby.
Go deeper on the local area
A Local Area report breaks down crime, transport links, schools and air quality in depth.
Road noise across the postcode
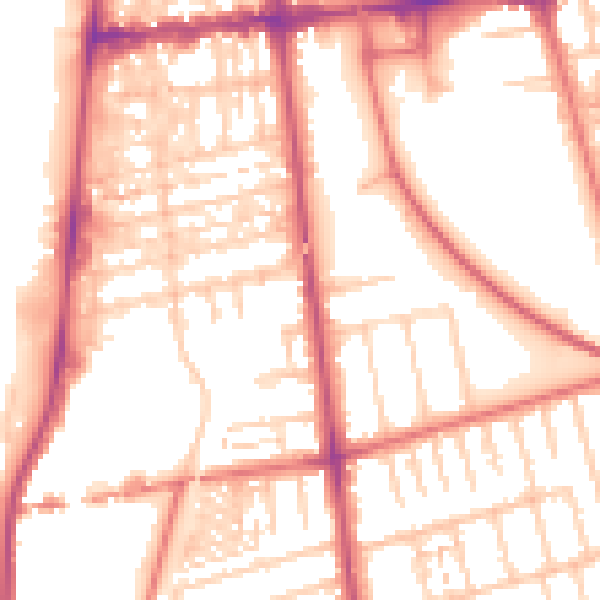
Daytime· 07:00 – 23:00
54.1dB

Night-time· 23:00 – 07:00
43.0dB