13 Hollingbury Place, Brighton, BN1 7GE
About 13 Hollingbury Place
13 Hollingbury Place is an end-of-terrace house in Brighton (BN1 7GE). It has a recorded floor area of 30 m² (around 323 sq ft) and construction records dating it to 1996-2002. At 30 m² this is the smallest unit on EPC record across the building (30–191 m²). The building's EPC ratings span E to B across 27 units on file. The latest certificate (January 2022) shows a C (score 73). The rating has held steady at C across 2 certificates since October 2009. Between certificates, roof efficiency dropped from Good to Average.
At 30 m² it sits well below the postcode median (89 m² across 26 EPCs), making it one of the more compact homes locally. Last sale on file: £311,407 in July 2019. Across the public record there are 5 sales, relatively high churn for a single property. One planning record on file: an extension approved in 2004. Past consents include an extension, meaningful when judging how the property has evolved. Across 2002–2019, sale prices on this property compounded at 5.6% per year. On a £-per-square-foot basis, the last sale (£964/sq ft) was about 284.9% above the typical sold price in the postcode.
Everything you need to know about 13 Hollingbury Place
The true value, the hidden risks and the full sale history, in one report.
Pick your report · from £14.99
One time fee only - money back guarantee
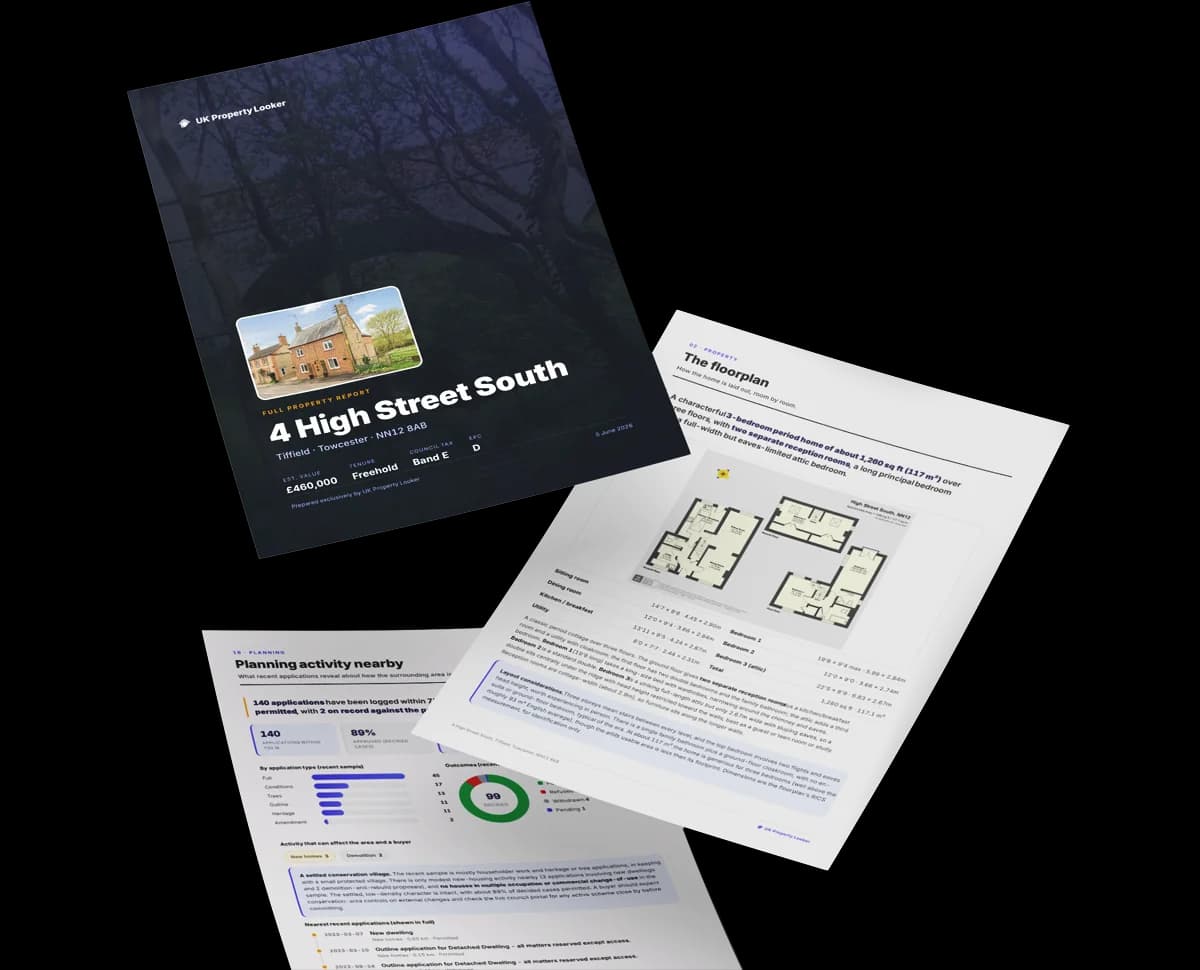
The data behind every report







Energy performance
13 Hollingbury Place's carbon output is low for the local stock.
EPC Rating
Certificate validity
Valid until 31 January 2032
Property Improvements
Changes detected from historical EPC data
Heating controls upgraded for better temperature management
More low energy lighting installed

Get a survey for this property
Level 2 HomeBuyer Report
We've checked 10 risk factors against the available data for this property and believe a Level 2 HomeBuyer Report could be a suitable option for you.
From £595 · Includes VAT
Planning history
1 application on record at 13 Hollingbury Place, Brighton, BN1 7GE
- Mar 2004ExtensionFullOutcome in report
Extension: Rear of property
Change of use from office (A2) to shop (A1) at ground floor. Erection of a two storey rear extension to form 1 No. 1 bed flat and 1 No. 2 bed maisonette. Dormer to rear and a new rooflight to the front.
- Documents
- 2 docs on file
- Reference
- BH2004/00343/FP
Unlock 13 Hollingbury Place, Brighton, BN1 7GE's full planning history
You're seeing the shape of it. The report has the substance.
- Every decision — granted, refused or withdrawn (1 on record)
- All 1 application on this property in full, plus 12 notable nearby
- The 2 documents, officer reports & conditions
- What the pattern means for extending or converting here
One time fee only - money back guarantee
Sales history & valuation
13 Hollingbury Place has more than doubled in price since the earliest registered sale in 2002.
£302,000
Modelled from EPC, postcode comparables and a sale-price growth of 5.6% per year over 18 years.
£311,407
Growth on file: 5.6% per year over 18 years.
Sales timeline
25 July 2019Most recent
£311,407
+3.8%over 9 years29 April 2010
£300,000
+106.9%over 5 years16 May 2004
£145,000
16 May 2004
£145,000
+20.8%over 2 years16 January 2002
£120,000
Median price across the last 5 sales in BN1 7GE: £555,000 (2025–2024).
Nearby sales in BN1 7GE
18 Hollingbury Place, Brighton, BN1 7GE
Sold Jul 2025
£625,00019 Hollingbury Place, Brighton, BN1 7GE
Sold Feb 2025
£555,00027a, Hollingbury Place, Brighton, BN1 7GE
Sold Nov 2024
£340,0002a, Hollingbury Place, Brighton, BN1 7GE
Sold Nov 2024
£320,00043 Hollingbury Place, Brighton, BN1 7GE
Sold Sept 2024
£620,000
Versus other Hollingbury Place homes
Price per m² for 13 Hollingbury Place runs comfortably ahead of the street norm.
Price per m²
£10,380
Street avg £4,514
Floor Area
30 m²
Street avg 63 m²
Habitable Rooms
2 rooms
Street avg 3 rooms
CO₂ Emissions
1.3 t/year
Street avg 2.3 t/year
Everything you need to know about 13 Hollingbury Place
The true value, the hidden risks and the full sale history, in one report.
Pick your report · from £14.99
One time fee only - money back guarantee
The data behind every report
Similar properties nearby
The neighbourhood at a glance
Crime
1110/mo
Falling year-on-year across the wider district.
Nearest stop
0.0 km
The Dip — bus stop.
Closest school
0.6 km
Hertford Primary School. 36 schools nearby.
Go deeper on the local area
A Local Area report breaks down crime, transport links, schools and air quality in depth.
Road noise across the postcode
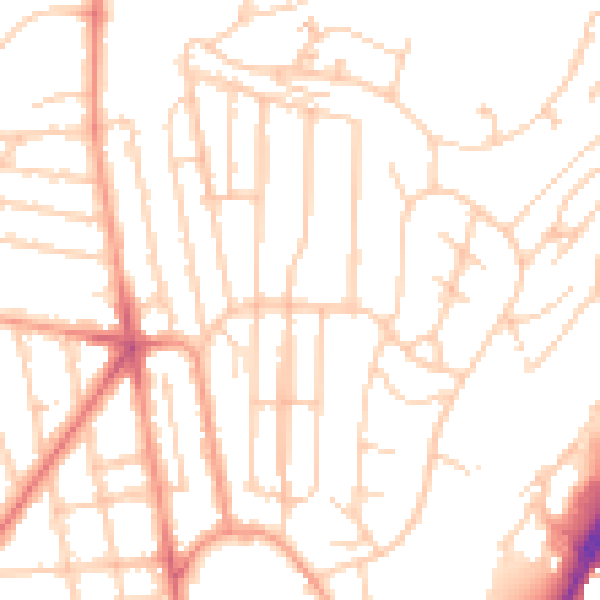
Daytime· 07:00 – 23:00
50.4dB

Night-time· 23:00 – 07:00
39.3dB