Model valuation£417,0008 Busby Close
Local market context
Estimated value
£126,000
Newest record on this page: February 2025. Land Registry and EPC registers update monthly, so this page can trail them by 2–3 months.
Our estimate
£126,000
Your note and figure are shown publicly on this page.
The estimate for 113 Montague Street is modelled from its 153 m² EPC floor area, its 1 recorded sale and recent sales of comparable homes in BB2 1EH. It is an automated estimate, not a survey or mortgage valuation: condition, layout and improvements that aren't on record can move the real figure either way.
Floor area
153 m² from the EPC lodged in August 2015
Sales of this home
1 sale recorded, the latest in 1999
Recent sales in BB2 1EH
5 sales, median £88,000 (2025–2007)
| Data | This page | Full report |
|---|---|---|
| Sales | Latest sale shown: February 2025 | Latest available records, read when you order |
| Valuation | Estimate from the last refresh | Analysed against comparable sales |
| Planning | None on this home | Full history, plus nearby schemes |
| Flood risk | Not shown | Included |
113 Montague Street's modelled value sits at over four times its earliest registered sale price (1999).
15 April 1999Most recent
£26,000
Median price across the last 5 sales in BB2 1EH: £88,000 (2025–2007).
One time fee only - money back guarantee
113 Montague Street is a mid-terrace house in Blackburn (BB2 1EH). It has a recorded floor area of 153 m² (around 1647 sq ft), construction records dating it to 1900-1929 and council tax band A. The latest certificate (August 2015) shows an E (score 46), well below the UK norm with real room to improve. The recommended improvements would push it to D (score 65). The latest certificate is from August 2015, so improvements made since then won't be reflected.
It hasn't traded since April 1999, a hold of 27 years that's notably long for the area. Only one transfer is on record with HM Land Registry, suggesting it has stayed in the same hands for a long time. Today's modelled estimate of £126,000 sits 384.6% above the 1999 sale of £26,000. On a £-per-square-foot basis, the last sale (£16/sq ft) was about 78% below the postcode norm. At 153 m² it's 24.4% larger than the typical home in the postcode (123 m² median across 12 EPCs).
The true value, the hidden risks and the full sale history, in one report.
Pick your report · from £14.99
One time fee only - money back guarantee
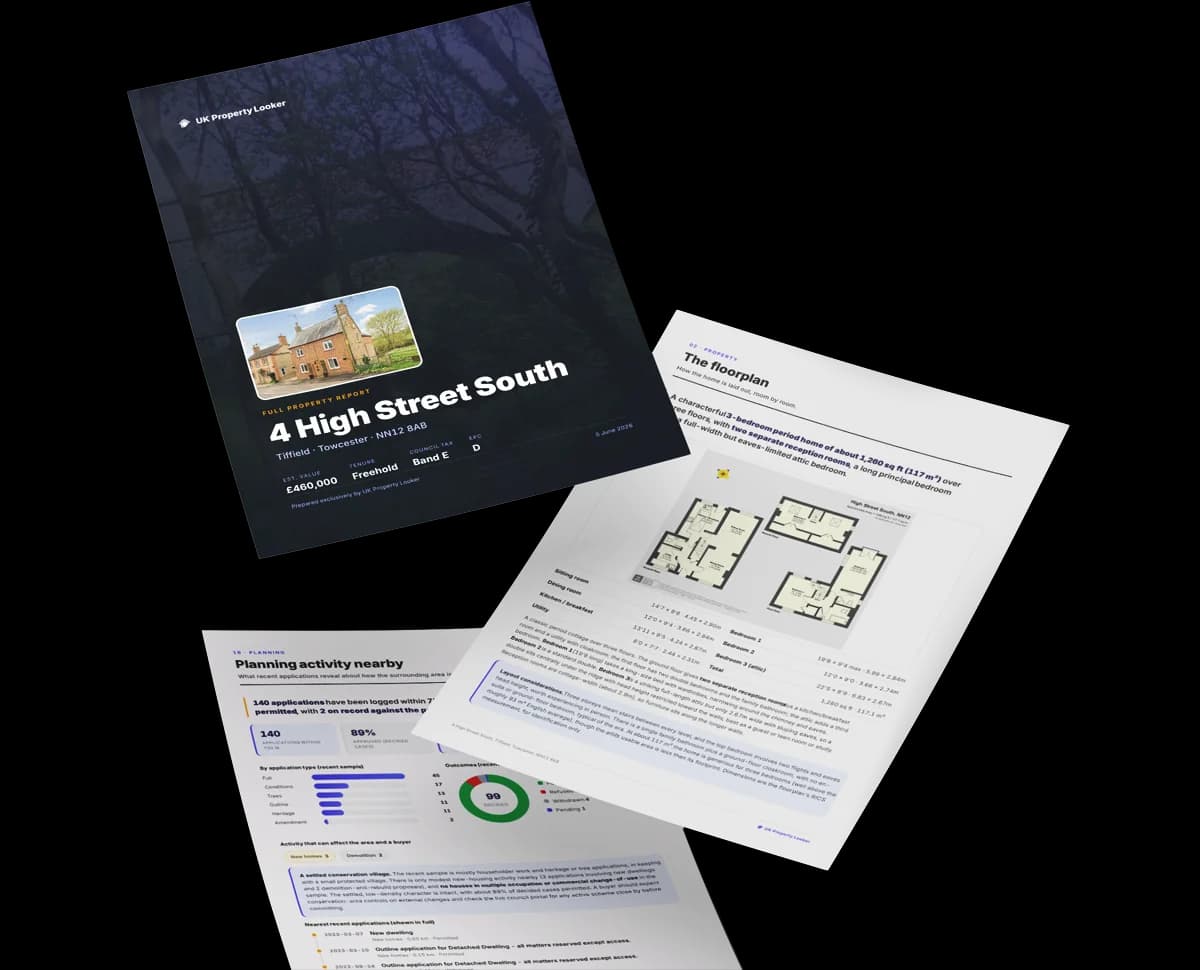
The data behind every report


113 Montague Street's carbon output runs well above what efficient homes in the postcode produce.
This certificate is over 10 years old and is no longer valid.Expired 22 Aug 2025
Certificate validity
Expired on 22 August 2025
113 Montague Street has no planning applications on record.
But the area is active
2 notable applications nearby — larger schemes and conversions that could reshape the street. The report maps them all.
On price per m², 113 Montague Street runs well behind the street norm.
Price per m²
£170
Street avg £741
Floor Area
153 m²
Street avg 130 m²
Habitable Rooms
7 rooms
Street avg 6 rooms
CO₂ Emissions
9.3 t/year
Street avg 7.5 t/year
Crime
566/mo
Falling year-on-year across the wider district.
Nearest stop
0.1 km
Higson Street — bus stop.
Closest school
0.3 km
Blackburn College. 44 schools nearby.
Go deeper on the local area
A Local Area report breaks down crime, transport links, schools and air quality in depth.

Daytime· 07:00 – 23:00
55.9dB

Night-time· 23:00 – 07:00
44.0dB

Get a survey for this property
Because the property was built before 1919 and has solid (non-cavity) walls, we believe a Level 3 building survey should be considered.
From £820 · Includes VAT
Property research, connected
Explore sale histories, valuations, energy ratings and local areas. Ask the assistant to connect the details and take your research further.
Start your researchLeave a note for other visitors about work done or anything the records miss, and say what you think it's worth. It takes about two minutes.