4 Belgrave Lane, Swansea, SA1 4QG
About 4 Belgrave Lane
4 Belgrave Lane is a semi-detached house in Swansea (SA1 4QG). It has a recorded floor area of 177 m² (around 1905 sq ft), construction records dating it to 1983-1990 and council tax band E. The latest certificate (April 2022) shows a D (score 68), on the cusp of jumping into the C band. The recommended improvements would push it to C (score 79).
At 177 m² the property is well over the postcode median (111 m² across 3 EPCs), placing it in the larger end of the local stock. Across 1997–2022, sale prices on this property compounded at 6.1% per year. On a £-per-square-foot basis, the last sale (£191/sq ft) was about 24.9% above the typical sold price in the postcode. Sold August 2022 for £363,000. That sale was during the post-pandemic price surge, when transactions cleared materially above pre-2020 trend.
Everything you need to know about 4 Belgrave Lane
The true value, the hidden risks and the full sale history, in one report.
Pick your report · from £14.99
One time fee only - money back guarantee
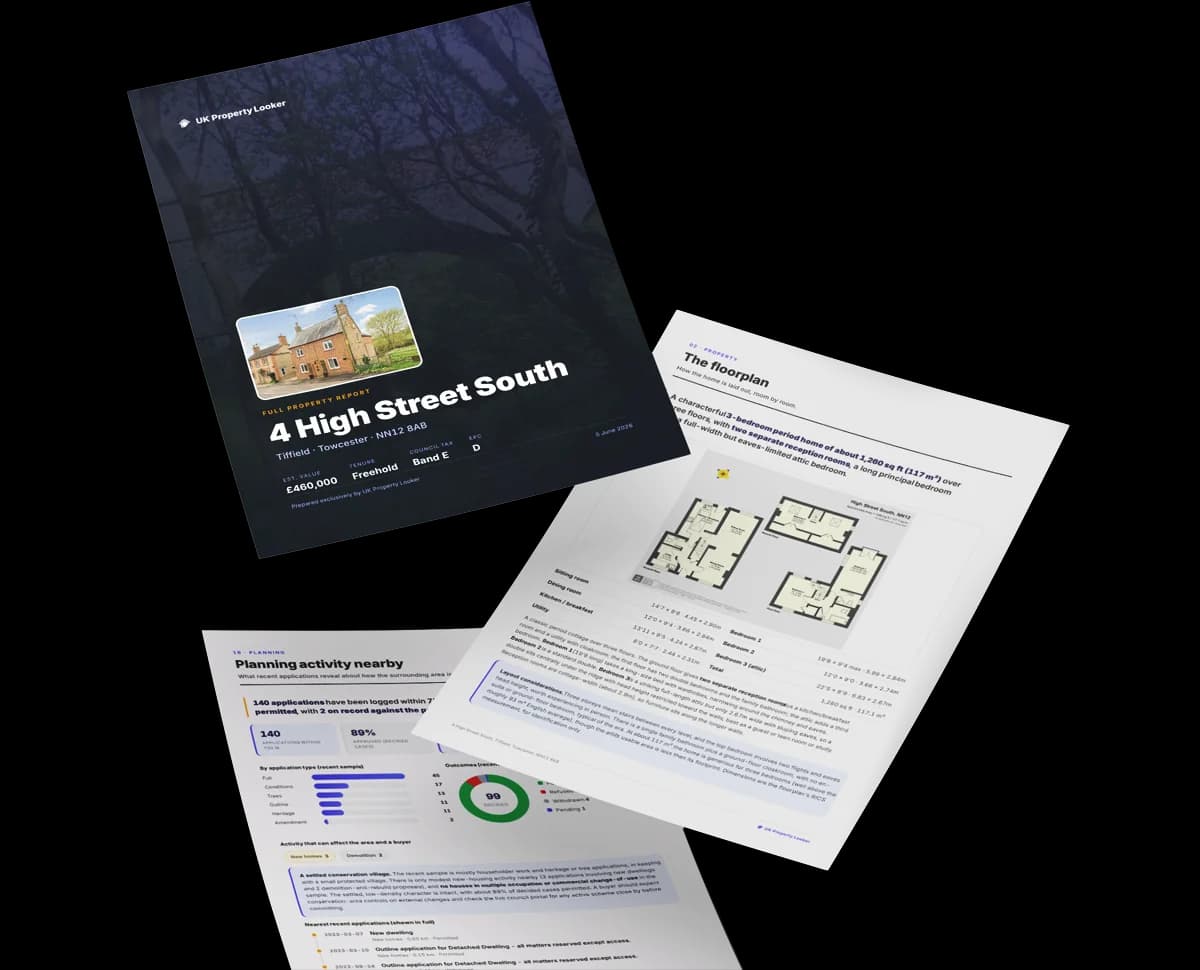
The data behind every report


Energy performance
EPC Rating
Certificate validity
Valid until 25 April 2032

Get a survey for this property
Level 2 HomeBuyer Report
We've checked 10 risk factors against the available data for this property and believe a Level 2 HomeBuyer Report could be a suitable option for you.
From £595 · Includes VAT
Planning history
4 Belgrave Lane has no planning applications on record.
But the area is active
44 notable applications nearby — larger schemes and conversions that could reshape the street. The report maps them all.
Sales history & valuation
Latest sale on 4 Belgrave Lane was the highest on Land Registry record across the postcode.
£396,000
Modelled from EPC, postcode comparables and a sale-price growth of 6.1% per year over 25 years.
£363,000
Growth on file: 6.1% per year over 25 years.
Sales timeline
18 August 2022Most recent
£363,000
+317.2%over 24 years8 October 1997
£87,000
+5.5%28 August 1997
£82,500
Median price across the last 5 sales in SA1 4QG: £205,000 (2019–2002).
Versus other Belgrave Lane homes
On price per m², 4 Belgrave Lane stands well clear of the street.
Price per m²
£2,051
Street avg £1,667
Floor Area
177 m²
Street avg 105 m²
Habitable Rooms
5 rooms
Street avg 4 rooms
CO₂ Emissions
5.6 t/year
Street avg 5.1 t/year
Everything you need to know about 4 Belgrave Lane
The true value, the hidden risks and the full sale history, in one report.
Pick your report · from £14.99
One time fee only - money back guarantee
The data behind every report
Similar properties nearby
The neighbourhood at a glance
Crime
580/mo
Steady year-on-year across the wider district.
Nearest stop
0.1 km
Richmond Villas — bus stop.
Go deeper on the local area
A Local Area report breaks down crime, transport links, schools and air quality in depth.