Model valuation£417,0008 Busby Close
Local market context
Estimated value
£476,000
Newest record on this page: February 2022. Land Registry and EPC registers update monthly, so this page can trail them by 2–3 months.
Our estimate
£476,000
Your note and figure are shown publicly on this page.
The estimate for 5 Blanford Walk is modelled from its 96 m² EPC floor area, its 3 recorded sales and recent sales of comparable homes in CB4 3NQ. It is an automated estimate, not a survey or mortgage valuation: condition, layout and improvements that aren't on record can move the real figure either way.
Floor area
96 m² from the EPC lodged in December 2021
Sales of this home
3 sales recorded, the latest in 2019
Recent sales in CB4 3NQ
5 sales, median £375,000 (2022–2008)
| Data | This page | Full report |
|---|---|---|
| Sales | Latest sale shown: February 2022 | Latest available records, read when you order |
| Valuation | Estimate from the last refresh | Analysed against comparable sales |
| Planning | None on this home | Full history, plus nearby schemes |
| Flood risk | Not shown | Included |
5 Blanford Walk has more than doubled in price since the earliest registered sale in 2001.
17 December 2019Most recent
£371,800
+79.2%over 14 years28 April 2005
£207,500
+48.3%over 3 years21 June 2001
£139,950
Median price across the last 5 sales in CB4 3NQ: £375,000 (2022–2008).
One time fee only - money back guarantee
5 Blanford Walk is a three-bedroom semi-detached house in Cambridge (CB4 3NQ). It has a recorded floor area of 96 m² (around 1033 sq ft), construction records dating it to 1967-1975 and council tax band D. The latest certificate (December 2021) shows a D (score 55), a step below the typical UK home. The rating has held steady at D across 2 certificates since March 2011. Between certificates, main heating went from Average to Good; while wall efficiency dropped from Average to Poor. The recommended improvements would lift it to B (score 84), a 2-band jump.
Across 2001–2019, sale prices on this property compounded at 5.4% per year. Today's modelled estimate of £476,000 is 28% above the 2019 sale price. On a £-per-square-foot basis, the last sale (£360/sq ft) was about 98.1% above the typical sold price in the postcode. At 96 m² it's 18.6% smaller than the typical home in the postcode (118 m² median across 6 EPCs). Most recent transfer: December 2019 at £371,800.
The true value, the hidden risks and the full sale history, in one report.
Pick your report · from £14.99
One time fee only - money back guarantee
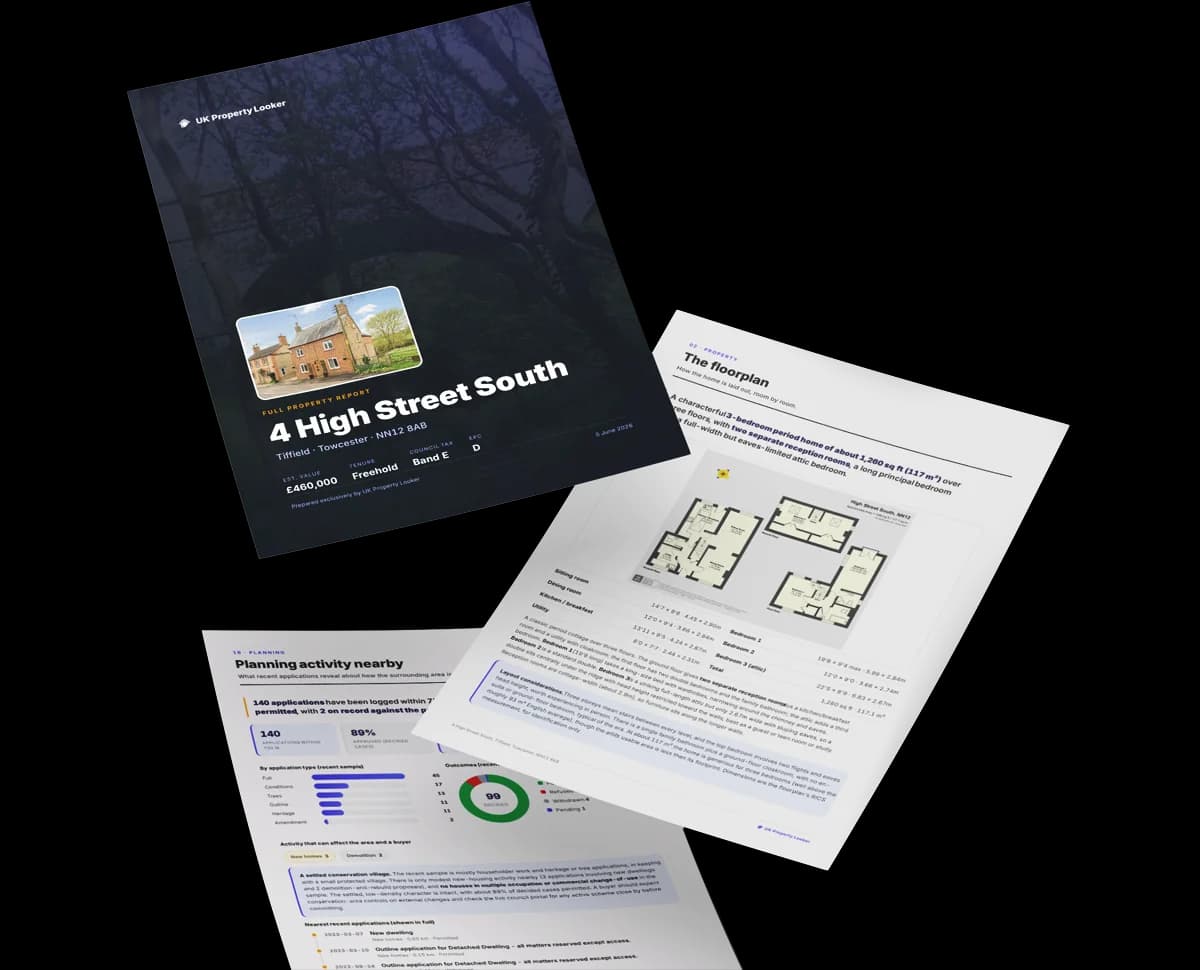
The data behind every report


Recommended upgrades on file would lift this property by multiple EPC bands.
Certificate validity
Valid until 2 December 2031
Changes detected from historical EPC data
More low energy lighting installed
5 Blanford Walk has no planning applications on record.
But the area is active
9 notable applications nearby — larger schemes and conversions that could reshape the street. The report maps them all.
5 Blanford Walk is notably below the street on co₂ emissions.
Price per m²
£3,873
Street avg £2,527
Floor Area
96 m²
Street avg 116 m²
Habitable Rooms
5 rooms
Street avg 7 rooms
CO₂ Emissions
5.4 t/year
Street avg 3.8 t/year
Crime
411/mo
Falling year-on-year across the wider district.
Closest school
0.7 km
Mayfield Primary School. 19 schools nearby.
Go deeper on the local area
A Local Area report breaks down crime, transport links, schools and air quality in depth.
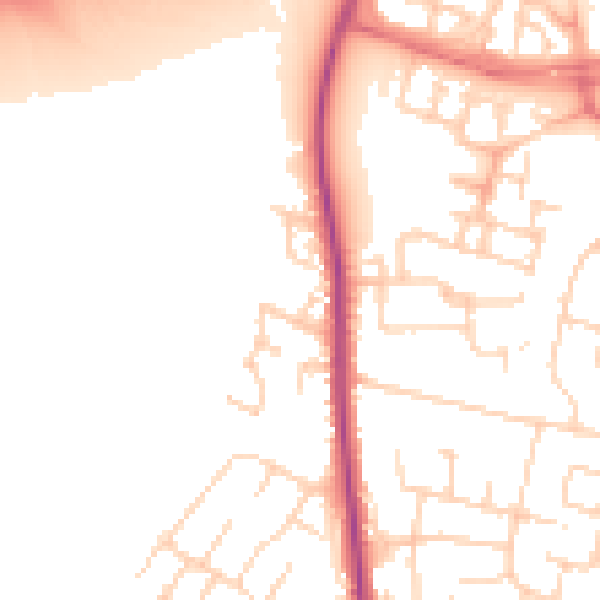
Daytime· 07:00 – 23:00
52.1dB

Night-time· 23:00 – 07:00
42.9dB

Get a survey for this property
Because the property has been extended more than once, we believe a Level 3 building survey should be considered.
From £1,020 · Includes VAT
Property research, connected
Explore sale histories, valuations, energy ratings and local areas. Ask the assistant to connect the details and take your research further.
Start your researchLeave a note for other visitors about work done or anything the records miss, and say what you think it's worth. It takes about two minutes.