39 Ennismore Street, Burnley, BB10 3DL
About 39 Ennismore Street
39 Ennismore Street is a three-bedroom mid-terrace house in Burnley (BB10 3DL). It has a recorded floor area of 88 m² (around 947 sq ft), construction records dating it to 1900-1929 and council tax band B. The latest certificate (March 2014) shows an F (score 36), near the bottom of the EPC scale. The recommended improvements would lift it to C (score 73), a 3-band jump. The latest certificate is from March 2014, so improvements made since then won't be reflected. Other recorded features include a loft.
Across 1995–2020, sale prices on this property compounded at 2.3% per year. Today's modelled estimate of £127,000 sits 58.7% above the 2020 sale of £80,000. On a £-per-square-foot basis, the last sale (£84/sq ft) was about 64.7% above the typical sold price in the postcode. At 88 m² it sits well below the postcode median (128 m² across 27 EPCs), making it one of the more compact homes locally. It lags the bulk of the postcode on energy efficiency (less efficient than 89% of similar EPCs). Last sale on file: £80,000 in October 2020.
What this property has
Inside
- Bedrooms3
- Bathrooms1
- Dining roomYes
- CloakroomYes
- LoftYes
Outside
- Private gardenYes
Everything you need to know about 39 Ennismore Street
The true value, the hidden risks and the full sale history, in one report.
Pick your report · from £14.99
One time fee only - money back guarantee
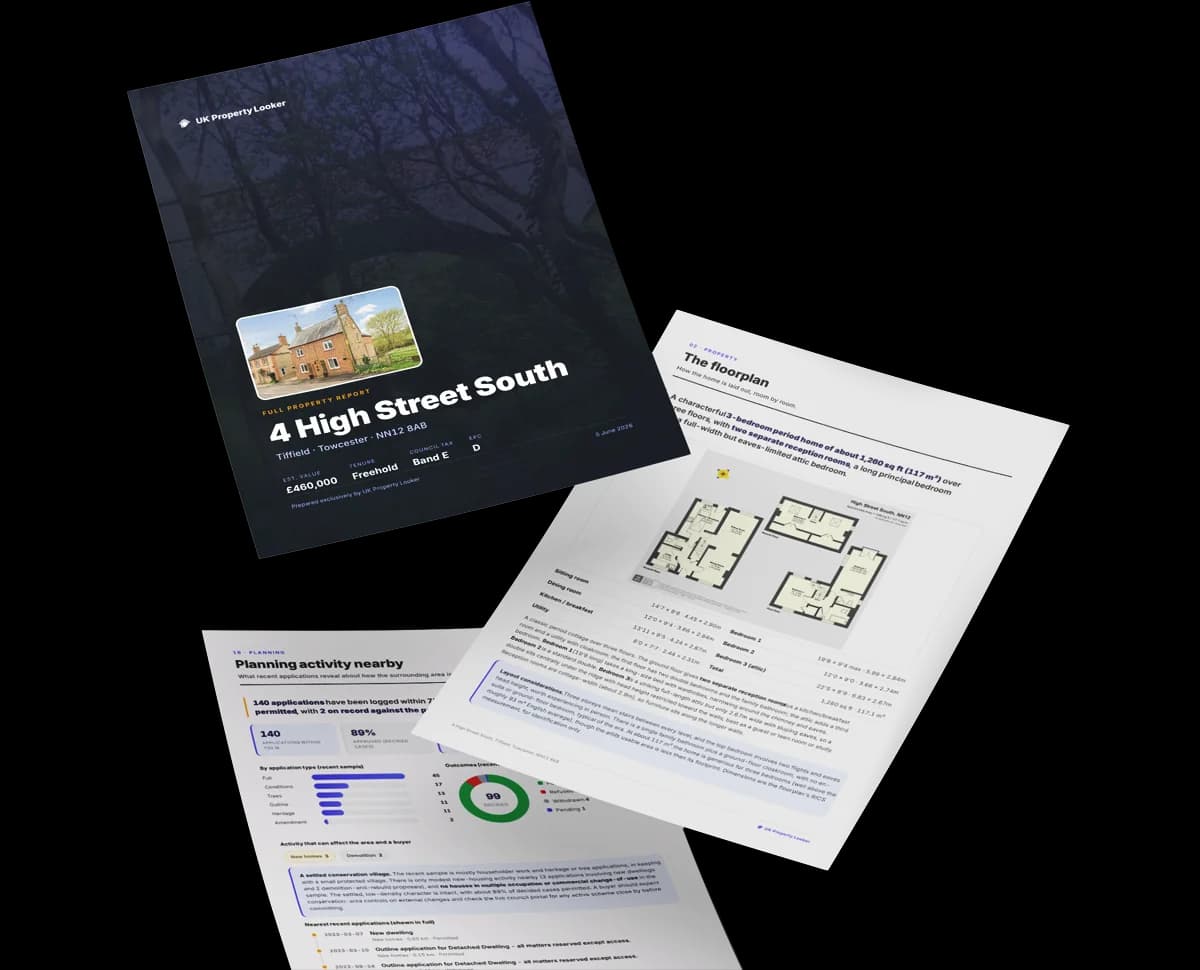
The data behind every report






Energy performance
39 Ennismore Street's carbon output runs well above what efficient homes in the postcode produce.
EPC Expired
This certificate is over 10 years old and is no longer valid.Expired 07 Mar 2024
EPC Rating
Certificate validity
Expired on 7 March 2024

Get a survey for this property
Level 3 Building Survey
Because the property was built before 1919, we believe a Level 3 building survey should be considered.
From £820 · Includes VAT
Planning history
39 Ennismore Street has no planning applications on record.
But the area is active
12 notable applications nearby — larger schemes and conversions that could reshape the street. The report maps them all.
Sales history & valuation
The latest sale landed in the post-pandemic price surge — useful context when reading the figure.
£127,000
Modelled from EPC, postcode comparables and a sale-price growth of 2.3% per year over 25 years.
£80,000
Growth on file: 2.3% per year over 25 years.
Sales timeline
28 October 2020Most recent
£80,000
+45.5%over 17 years25 September 2003
£55,000
+22.2%over 7 years15 December 1995
£45,000
Median price across the last 5 sales in BB10 3DL: £125,000 (2025–2023).
Nearby sales in BB10 3DL
47 Ennismore Street, Burnley, BB10 3DL
Sold Aug 2025
£120,00057 59, Ennismore Street, Burnley, BB10 3DL
Sold Dec 2024
£170,00055 Ennismore Street, Burnley, BB10 3DL
Sold Sept 2024
£120,00053 Ennismore Street, Burnley, BB10 3DL
Sold Oct 2023
£125,00043 Ennismore Street, Burnley, BB10 3DL
Sold May 2023
£115,000
Versus other Ennismore Street homes
Floor Area for 39 Ennismore Street lags the street by a wide margin.
Price per m²
£909
Street avg £722
Floor Area
88 m²
Street avg 131 m²
Habitable Rooms
5 rooms
Street avg 6 rooms
CO₂ Emissions
7.4 t/year
Street avg 9.2 t/year
Everything you need to know about 39 Ennismore Street
The true value, the hidden risks and the full sale history, in one report.
Pick your report · from £14.99
One time fee only - money back guarantee
The data behind every report
Similar properties nearby
1 Cromer Avenue
BB10 3HA
1 Brow View
BB10 3BW
1 Aspen Drive
BB10 3FB
1 Brun Terrace
BB10 3JR
1 Ennismore Street
BB10 3DL
1 Copperfield Close
BB10 3RT
1 Chapel Street, Worsthorne
BB10 3NR
1 Dry Clough Barn, Shelfield Lane, Southfield
BB10 3RF
The neighbourhood at a glance
Crime
237/mo
Falling year-on-year across the wider district.
Nearest stop
0.0 km
Ennismoor Street — bus stop.
Closest school
0.2 km
Heasandford Primary School. 26 schools nearby.
Go deeper on the local area
A Local Area report breaks down crime, transport links, schools and air quality in depth.