Skip to content

99 Queensway, Brighton, BN2 0FA

Estimated value

£219,000

  • Since the 2017 sale (£185,000)+18%
  • Against BN2 0FA's recent median (£238,000)-8%

Newest record on this page: October 2022. Land Registry and EPC registers update monthly, so this page can trail them by 2–3 months.

Learn about this valuation
Property type
End terrace
Floor 2nd
Habitable rooms
2
From EPC
Floor area
48 m²
517 sq ft
Energy rating
C
Score 74
Council tax
Band A
Tenure
Owner Occupied
Get directions (opens in a new tab)
Valuation

About this valuation

How the figure is worked out and what it's based on. If you know this home, you can tell other visitors what you think it's worth.

Our estimate

£219,000

  • Against its 2017 sale (£185,000)+18%
  • Against BN2 0FA's recent median (£238,000)-8%

Your note and figure are shown publicly on this page.

How the estimate is made

The estimate for 99 Queensway is modelled from its 48 m² EPC floor area, its 1 recorded sale and recent sales of comparable homes in BN2 0FA. It is an automated estimate, not a survey or mortgage valuation: condition, layout and improvements that aren't on record can move the real figure either way.

What it's based on

  • Floor area

    48 m² from the EPC lodged in August 2020

  • Sales of this home

    1 sale recorded, the latest in 2017

  • Recent sales in BN2 0FA

    5 sales, median £238,000 (2022–2017)

This page or the full report?

DataThis pageFull report
SalesLatest sale shown: October 2022Latest available records, read when you order
ValuationEstimate from the last refreshAnalysed against comparable sales
PlanningNone on this homeFull history, plus nearby schemes
Flood riskNot shownIncluded
Price

Sales history & valuation

Every recorded sale of this home, how its price has moved, and what neighbouring properties have sold for.

99 Queensway valuation sits well clear of the typical sold price in this postcode.

Risks

What this page doesn't show

2 potential issues have already been flagged for 99 Queensway, Brighton, BN2 0FA. The detail, evidence and what to ask about it are in the Risks Report.
  • Signs of HMO activity in the areaIn report
  • Larger development activity nearbyIn report
  • Flood risk from rivers, sea and surface waterIn report
  • Subsidence and ground-stability signalsIn report
  • Refusals, enforcement and big schemes nearbyIn report

One time fee only - money back guarantee
Overview

About 99 Queensway

A plain-English summary derived from public records, EPC certificates, sold prices and local data.

99 Queensway is an end-of-terrace house in Brighton (BN2 0FA). It has a recorded floor area of 48 m² (around 517 sq ft), construction records dating it to 1950-1966 and council tax band A. The latest certificate (August 2020) shows a C (score 74). When first surveyed in February 2014 the rating was F, the property has climbed 3 bands since. Between certificates, hot-water efficiency went from Poor to Good, lighting went from Very Poor to Good and main heating went from Very Poor to Good; while wall efficiency dropped from Good to Average. At 48 m² this is the 12th smallest of 37 units on EPC record in the building, where floor areas span 44–125 m². The building's EPC ratings span E to B across 37 units on file.

Today's modelled estimate of £219,000 is 18.4% above the 2017 sale price. On a £-per-square-foot basis, the last sale (£358/sq ft) was about 56.4% above the typical sold price in the postcode. On the market in February 2017 and unlisted since — roughly 9 years.

Before you decide

Everything you need to know about 99 Queensway

The true value, the hidden risks and the full sale history, in one report.

Signs of HMO activity in the areaLarger development activity nearby

Pick your report · from £14.99

One time fee only - money back guarantee

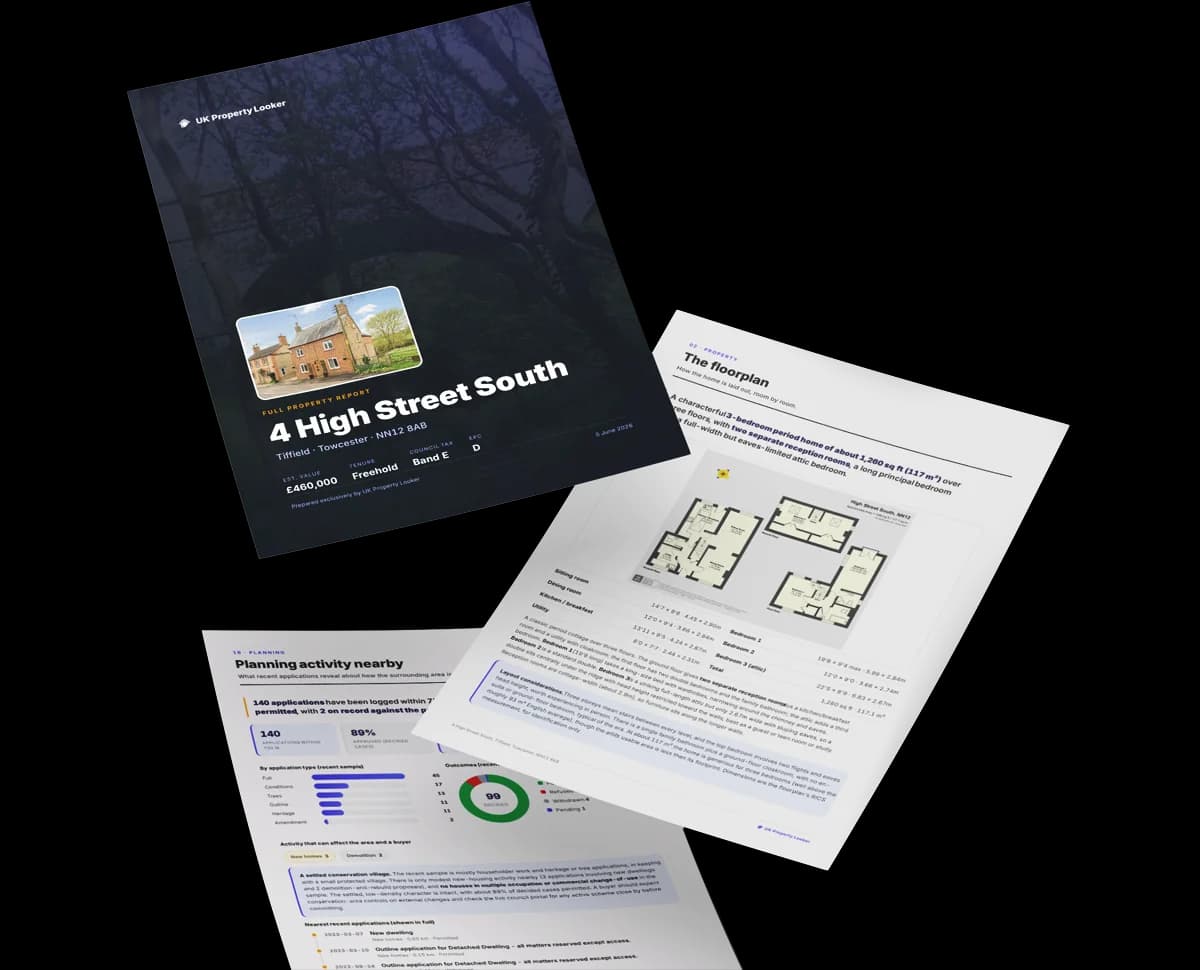
Preview of the full property report

The data behind every report

  • HM Land Registry, source of sold price history
  • Department for Education, source of schools data
  • Police.uk, source of crime statistics
  • Department for Transport, source of stations and transport links
  • Environment Agency, source of flood risk data
  • Department for Environment, Food & Rural Affairs, source of road noise data
  • PlanIt, source of planning application records
Energy

Energy performance

Every EPC certificate filed against this property — current rating, recorded improvements, and where there's headroom to reach a higher band.

99 Queensway's carbon output is low for the local stock.

Current Certificate(1 of 2)
Aug 2020

EPC Rating

A
B
C
C74
D
E
F
G
Main Heating
Gas
Main Fuel
Gas
Hot Water
Good
Windows
Average
CO2 Emissions
1.5 t/year
Occupancy
Owner Occupied

Certificate validity

Valid until 27 August 2030

3 years remaining

Property Improvements

Changes detected from historical EPC data

Aug 2020from Feb 2014
EPC improved fromF36toC74
Heating System
Room HeatersGas Boiler

Upgraded to gas central heating

Hot Water
PoorGood

Hot water efficiency improved

Low Energy Lighting
0%67%

More low energy lighting installed

Planning

Planning history

Applications and permits filed against 99 Queensway, Brighton, BN2 0FA, sourced from the PlanIt planning register.

99 Queensway has no planning applications on record.

8

But the area is active

8 notable applications nearby — larger schemes and conversions that could reshape the street. The report maps them all.

On the street

Versus other Queensway homes

Four headline reads against 33 similar flats on this street, drawn from the latest EPC and Land Registry data.

Price per m² for 99 Queensway runs comfortably ahead of the street norm.

Price per m²

£3,854

Street avg £2,783

Strongly above

Floor Area

48 m²

Street avg 55 m²

Below

Habitable Rooms

2 rooms

Street avg 3 rooms

Below

CO₂ Emissions

1.5 t/year

Street avg 1.7 t/year

Above
Area

The neighbourhood at a glance

A condensed read of the local area. Each tile links through to the full breakdown on the Brighton district page.

Daytime road noise here sits well below conversation level — a quiet pocket of the postcode.

Crime

632/mo

Falling year-on-year across the wider district.

Nearest stop

0.0 km

Hadlow Close — bus stop.

Closest school

0.2 km

St Luke's Primary School. 26 schools nearby.

Nearest schools

  • St Luke's Primary SchoolPrimary205m
  • St John the Baptist Catholic Primary SchoolPrimary443m
  • Elm Grove Primary SchoolPrimary629m
  • Queen's Park Primary SchoolPrimary644m

Nearest stops

  • Hadlow CloseBus stop22m
  • St Luke's TerraceBus stop96m
  • Tilgate CloseBus stop157m
  • Freshfield RoadBus stop187m

Most reported crime locally

  • Violence & Sexual Offences3,722 reports35%
  • Anti-social Behaviour1,996 reports19%
  • Public Order1,011 reports9%
  • Shoplifting840 reports8%

Go deeper on the local area

A Local Area report breaks down crime, transport links, schools and air quality in depth.
Noise

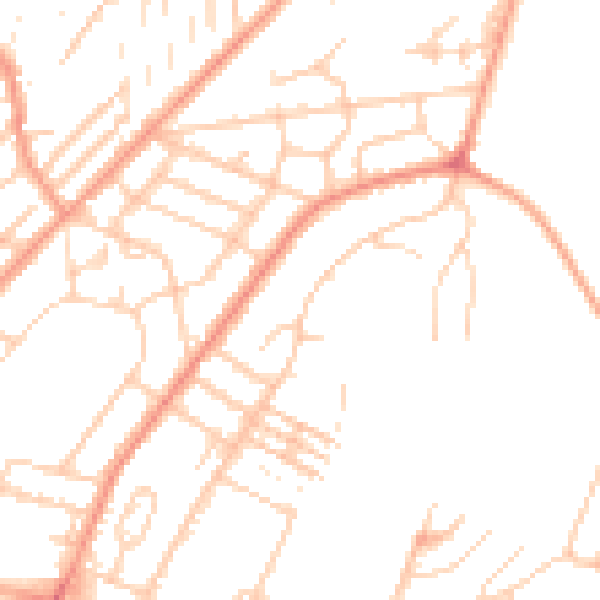
Road noise across the postcode

Modelled day and night-time noise levels around BN2 0FA from Defra's strategic mapping. The pin marks this postcode's centroid.
Daytime road noise heatmap for BN2 0FA

Daytime· 07:00 – 23:00

48.6dB

Low
Night-time road noise heatmap for BN2 0FA

Night-time· 23:00 – 07:00

37.9dB

Low
55 dB
60 dB
65 dB
70 dB
75 dB
80 dB
Defra Road Noise Strategic Mapping, Round 4
SDL Surveying

Get a survey for this property

Level 2 HomeBuyer Report

Mid 20th century2nd Floor FlatEPC C

We've checked 10 risk factors against the available data for this property and believe a Level 2 HomeBuyer Report could be a suitable option for you.

From £545 · Includes VAT

Property research, connected

Get up to date data on unlimited properties per month

Explore sale histories, valuations, energy ratings and local areas. Ask the assistant to connect the details and take your research further.

Start your research
Method

How to read this page

Where every figure above comes from, how current it is and what it can't tell you.
How the estimate is made
The estimate for 99 Queensway is modelled from its 48 m² EPC floor area, its 1 recorded sale and recent sales of comparable homes in BN2 0FA. It is an automated estimate, not a survey or mortgage valuation: condition, layout and improvements that aren't on record can move the real figure either way.
Where sold prices come from
Sold prices are HM Land Registry Price Paid Data, which covers residential sales in England and Wales since 1995. 1 sale is recorded for 99 Queensway. Sales normally appear two to three months after completion, so the most recent ones take time to show up anywhere.
Reading the EPC
Energy Performance Certificates rate homes from A (most efficient) to G and last 10 years. The latest one for 99 Queensway was lodged in August 2020 at band C and is valid until August 2030. 2 certificates are on record, which shows how the home has changed.
Planning records
Planning applications are collected from local authority registers through PlanIt. None is matched to 99 Queensway. Councils sometimes file applications under a different address format, and applications on neighbouring land aren't listed here; the report covers both.
Area figures
Crime is police-recorded street-level data over the last 17 months, which places each incident at an approximate point. The 26 schools and 30 stops listed are measured in a straight line from BN2 0FA, not by walking route. Road noise is Defra's strategic noise modelling, averaged across the postcode.
Council tax band
99 Queensway is in council tax band A. Bands are set by the Valuation Office Agency from historic values (1 April 1991 in England, 1 April 2003 in Wales), not today's price; the amount you pay depends on the council's rate for the band.
FAQ

Common questions

The questions buyers, sellers and homeowners most often ask about 99 Queensway, Brighton, BN2 0FA. Each answer is also embedded as structured data for search engines.

Know this home? Think our valuation is wrong?

Leave a note for other visitors about work done or anything the records miss, and say what you think it's worth. It takes about two minutes.