49 Hollingbury Rise, Brighton, BN1 7HH
About 49 Hollingbury Rise
49 Hollingbury Rise is a three-bedroom mid-terrace house in Brighton (BN1 7HH). It has a recorded floor area of 87 m² (around 936 sq ft), construction records dating it to 1930-1949 and council tax band C. The latest certificate (July 2020) shows a D (score 60), on the cusp of jumping into the C band. The recommended improvements would lift it to B (score 87), a 2-band jump. Other recorded features include notable views. Our model identifies extension potential, subject to local planning policy.
Today's modelled estimate of £470,000 is 11.9% above the 2021 sale price. On a £-per-square-foot basis, the last sale (£448/sq ft) was about 103.6% above the typical sold price in the postcode. Sold March 2021 for £420,000. That sale was during the post-pandemic price surge, when transactions cleared materially above pre-2020 trend.
What this property has
Inside
- Bedrooms3
- Bathrooms1
Outside
- Private gardenRear
- Notable viewsYes
Building
- Extension potentialPossible
Everything you need to know about 49 Hollingbury Rise
The true value, the hidden risks and the full sale history, in one report.
Pick your report · from £14.99
One time fee only - money back guarantee
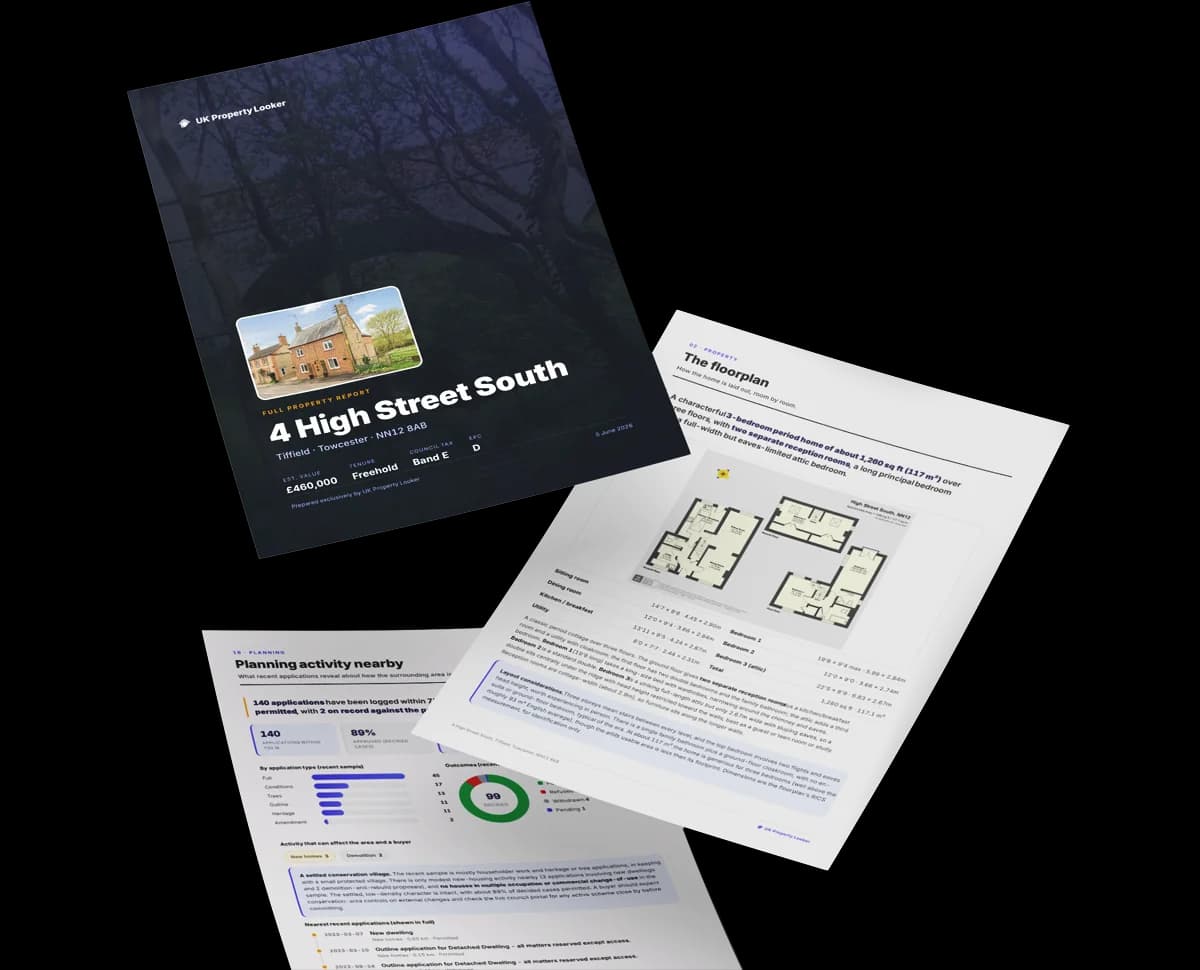
The data behind every report






Energy performance
Recommended upgrades on file would lift this property by multiple EPC bands.
EPC Rating
Certificate validity
Valid until 14 July 2030

Get a survey for this property
Level 2 HomeBuyer Report
We've checked 10 risk factors against the available data for this property and believe a Level 2 HomeBuyer Report could be a suitable option for you.
From £695 · Includes VAT
Planning history
49 Hollingbury Rise has no planning applications on record.
But the area is active
12 notable applications nearby — larger schemes and conversions that could reshape the street. The report maps them all.
Sales history & valuation
The latest sale landed in the post-pandemic price surge — useful context when reading the figure.
£470,000
Modelled from EPC, postcode comparables.
£420,000
Recorded with HM Land Registry.
Sales timeline
2 March 2021Most recent
£420,000
Median price across the last 5 sales in BN1 7HH: £433,000 (2025–2020).
Nearby sales in BN1 7HH
Versus other Hollingbury Rise homes
49 Hollingbury Rise outperforms the street on price per m² by a wide margin.
Price per m²
£4,828
Street avg £3,422
Floor Area
87 m²
Street avg 93 m²
Habitable Rooms
4 rooms
Street avg 5 rooms
CO₂ Emissions
4.5 t/year
Street avg 4.0 t/year
Everything you need to know about 49 Hollingbury Rise
The true value, the hidden risks and the full sale history, in one report.
Pick your report · from £14.99
One time fee only - money back guarantee
The data behind every report
Similar properties nearby
The neighbourhood at a glance
Rail-style transport is unusually close for this postcode.
Crime
1110/mo
Falling year-on-year across the wider district.
Nearest stop
0.1 km
Brentwood Crescent — bus stop.
Closest school
0.5 km
Hertford Primary School. 34 schools nearby.
Go deeper on the local area
A Local Area report breaks down crime, transport links, schools and air quality in depth.
Road noise across the postcode
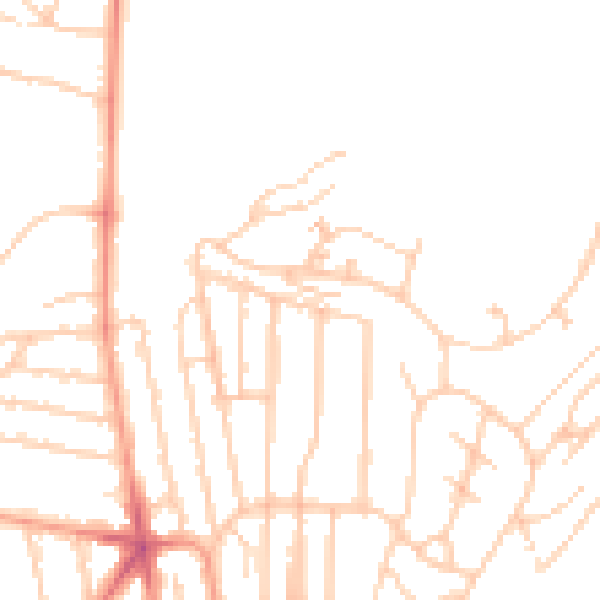
Daytime· 07:00 – 23:00
47.4dB

Night-time· 23:00 – 07:00
37.6dB