Are you a property professional?Get qualified leads from motivated homeowners.
Get started26 Seymour Street, Cambridge, CB1 3DQ
6 sales on record
About 26 Seymour Street
A plain-English summary derived from public records, EPC certificates, sold prices and local data.
26 Seymour Street is a two-bedroom end-of-terrace house in Cambridge (CB1 3DQ). It has a recorded floor area of 78 m² (around 840 sq ft), construction records dating it to before 1900 and council tax band C. The latest certificate (December 2022) shows a D (score 67), on the cusp of jumping into the C band. The rating has held steady at D across 3 certificates since May 2011. Between certificates, wall efficiency went from Very Poor to Good, roof efficiency went from Good to Very Good and window efficiency went from Poor to Average. The recommended improvements would push it to C (score 80). Records show the property has been extended at some point in its history.
Sale prices here have outpaced Cambridge HPI: 7.3% per year against 0% for the wider region. On a £-per-square-foot basis, the last sale (£691/sq ft) was about 106.1% above the typical sold price in the postcode. Most recent transfer was March 2025 at £580,000 — fresh data. 5 planning records sit against the property, 2 approved, 3 refused. Past consents include an extension, meaningful when judging how the property has evolved.
What this property has
Pulled from EPC certificates, claim submissions and our property model. Empty categories are hidden — we only show what's known.
Inside
- Bedrooms2
- Bathrooms1
- Dining roomYes
- StudyYes
Energy performance
Every EPC certificate filed against this property — current rating, recorded improvements, and where there's headroom to reach a higher band.
Current Certificate(1 of 3)
Dec 2022
EPC Rating
A
B
C
D
D67
E
F
G
Main Heating
Gas
Main Fuel
Gas
Hot Water
Good
Windows
Average
CO2 Emissions
2.5 t/year
Occupancy
Owner Occupied
Planning history
Applications and permits filed against 26 Seymour Street, Cambridge, CB1 3DQ, sourced from the PlanIt planning register.
A recent planning application at 26 Seymour Street was refused — worth checking the council file.
- Oct 2025ExtensionFullWithdrawn
Extension: Single storey · Side and rear of property
First floor side/rear extension, installation of rooflights to front and rear elevation, alterations to fenestration and new garden studio.
Sales history & valuation
Recorded transactions, our model's current estimate, and a quick read on what neighbouring properties have sold for.
26 Seymour Street has more than quadrupled in price since its earliest registered sale in 1995.
Current estimate
See how we calculated this£607,000
Modelled from EPC, postcode comparables and a sale-price growth of 7.3% per year over 30 years.
Last sold (2025)
£580,000
Growth on file: 7.3% per year over 30 years.
Sales timeline
Versus other Seymour Street homes
Four headline reads against 15 similar houses on this street, drawn from the latest EPC and Land Registry data.
26 Seymour Street is notably below the street on years held.
Price per m²
£7,436
Street avg £4,692
Floor Area
78 m²
Street avg 96 m²
Habitable Rooms
4 rooms
Street avg 5 rooms
Similar properties nearby
A handful of close matches in the same postcode area, ranked by likeness on bedrooms, type and floor area.
The neighbourhood at a glance
A condensed read of the local area. Each tile links through to the full breakdown on the Cambridge district page.
Reported crime in the wider district is trending notably upward year-on-year.
Crime
4/mo
Rising year-on-year across the wider district.
Nearest stop
1.2 km
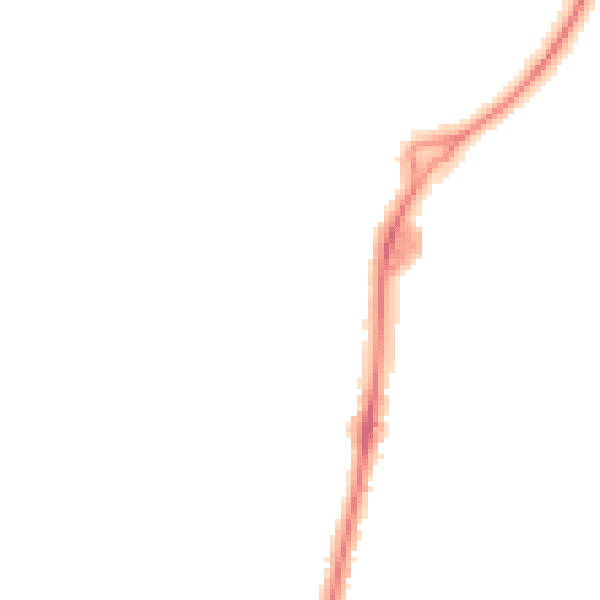
Road noise across the postcode
Modelled day and night-time noise levels around CB1 3DQ from Defra's strategic mapping. The pin marks this postcode's centroid.
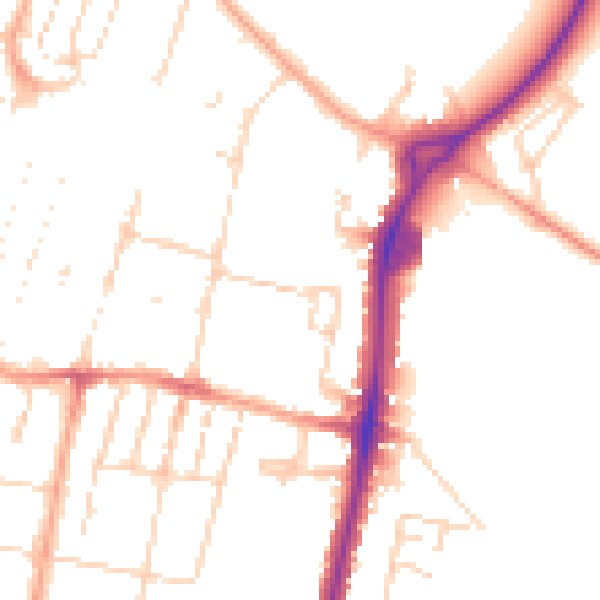
Daytime· 07:00 – 23:00
50.2dB
Everything within walking distance
Schools, transport stops and scenic spots near this property — 32 points of interest in total.
Beautiful places to visit nearby
Curated scenic spots within reach of this postcode, served by Beautifulplaces.ai. Photography and tagging come from their open dataset.
Common questions
The questions buyers, sellers and homeowners most often ask about 26 Seymour Street, Cambridge, CB1 3DQ. Each answer is also embedded as structured data for search engines.