Are you a property professional?Get qualified leads from motivated homeowners.
Get started7 Belmore Road, Lymington, SO41 3NU
5 sales on record
About 7 Belmore Road
A plain-English summary derived from public records, EPC certificates, sold prices and local data.
7 Belmore Road is a three-bedroom detached house in Lymington (SO41 3NU). It has a recorded floor area of 145 m² (around 1561 sq ft), construction records dating it to 1967-1975 and council tax band F. The latest certificate (July 2013) shows a D (score 68), on the cusp of jumping into the C band. The rating has held steady at D across 2 certificates since February 2010. Between certificates, wall efficiency went from Poor to Good and lighting went from Very Poor to Poor; while roof efficiency dropped from Good to Average and hot-water efficiency dropped from Very Good to Good. The recommended improvements would lift it to B (score 81), a 2-band jump. The latest certificate is from July 2013, so improvements made since then won't be reflected.
Sale prices here have outpaced England HPI: 8.1% per year against 0% for the wider region. Today's modelled estimate of £709,000 is 21.2% above the 2015 sale price. Last sold in September 2015, so it's been off the market for around 11 years. Across the public record there are 5 sales, relatively high churn for a single property. At 145 m² it's 29.5% larger than the typical home in the postcode (112 m² median across 9 EPCs).
What this property has
Pulled from EPC certificates, claim submissions and our property model. Empty categories are hidden — we only show what's known.
Inside
- Bedrooms3
Energy performance
Every EPC certificate filed against this property — current rating, recorded improvements, and where there's headroom to reach a higher band.
Recommended upgrades on file would lift this property by multiple EPC bands.
EPC Expired
This certificate is over 10 years old and is no longer valid.Expired 25 Jul 2023
Sales history & valuation
Recorded transactions, our model's current estimate, and a quick read on what neighbouring properties have sold for.
7 Belmore Road has more than tripled in price since its earliest registered sale in 1998.
Current estimate
See how we calculated this£709,000
Modelled from EPC, postcode comparables and a sale-price growth of 8.1% per year over 17 years.
Last sold (2015)
£585,000
Growth on file: 8.1% per year over 17 years.
Sales timeline
Full property reportLaunch offer · 33% off
The complete analysis of 7 Belmore Road, Lymington, SO41 3NU
Everything we know about this property, compiled into one in-depth, downloadable report.
Detailed AI analysis
Versus other Belmore Road homes
Four headline reads against 9 similar houses on this street, drawn from the latest EPC and Land Registry data.
7 Belmore Road outperforms the street on epc rating by a wide margin.
Price per m²
£4,034
Street avg £4,392
Floor Area
145 m²
Street avg 130 m²
Habitable Rooms
6 rooms
Street avg 6 rooms
Similar properties nearby
A handful of close matches in the same postcode area, ranked by likeness on bedrooms, type and floor area.
The neighbourhood at a glance
A condensed read of the local area. Each tile links through to the full breakdown on the Lymington district page.
Crime
4/mo
Steady year-on-year across the wider district.
Nearest stop
0.2 km
Priestlands Place — bus stop.
Road noise across the postcode
Modelled day and night-time noise levels around SO41 3NU from Defra's strategic mapping. The pin marks this postcode's centroid.
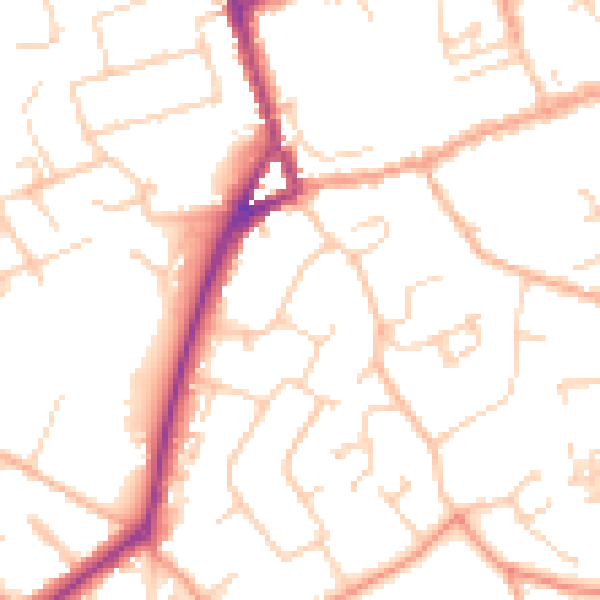
Daytime· 07:00 – 23:00
50.2dB

Everything within walking distance
Schools, transport stops and scenic spots near this property — 36 points of interest in total.
Common questions
The questions buyers, sellers and homeowners most often ask about 7 Belmore Road, Lymington, SO41 3NU. Each answer is also embedded as structured data for search engines.